| .. | ||
| Demo_Debugger_Integration.py | ||
| PySimpleGUIdebugger.py | ||
| readme.md | ||
PySimpleGUIdebugger
PySimpleGUI now has it's own built-in, sorta, debugger.
What you can do with this "debugger" is:
- Set "watch points" that update in realtime
- Write expressions that update in realtime
- Use a REPL style prompt to type in "code" / modify variables
All of this is done using a window secondary and separate from your primary application window.
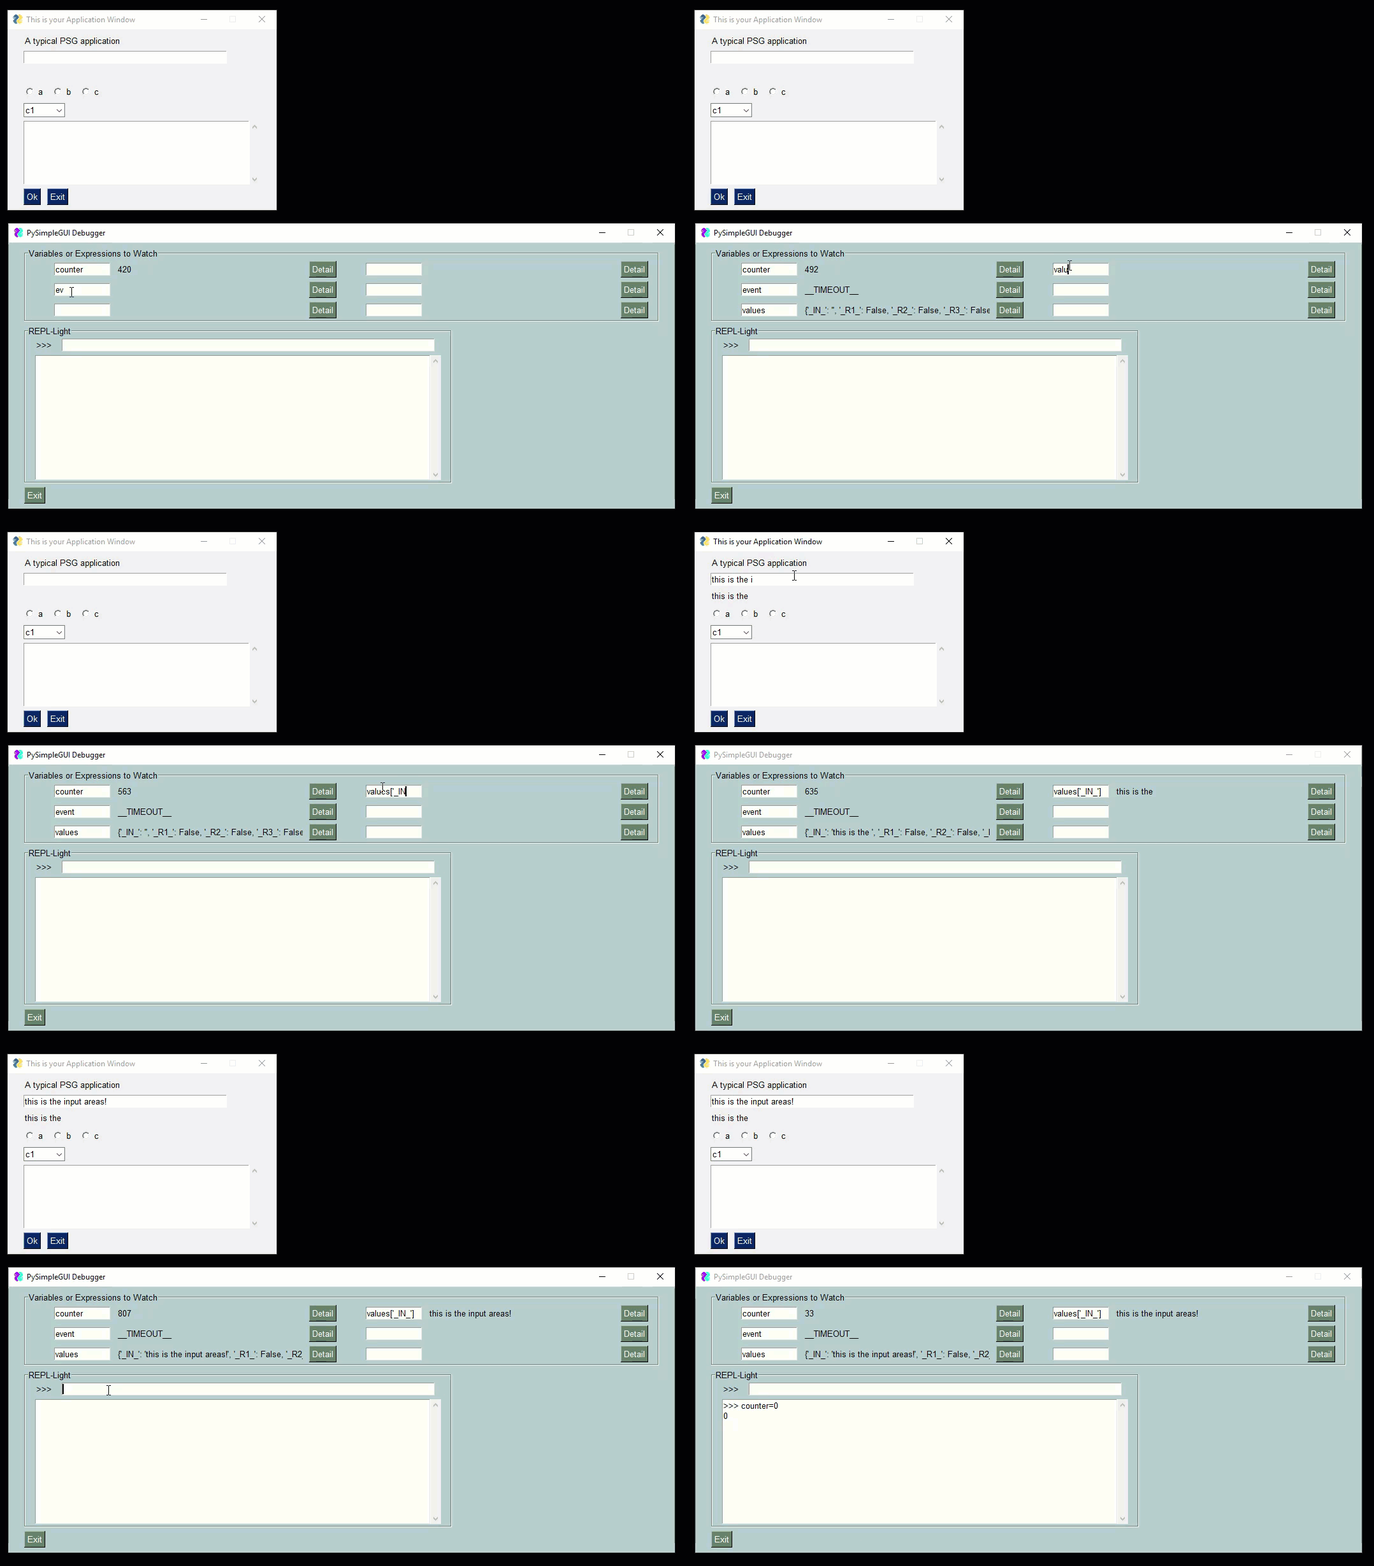
Check out this video as a guide. The user's window is the smaller one one top. The PySimpleGUIdebugger is the green window on the buttom. You can watch variables, evaluate expressions, even xecute code.
Installation
Installation is via pip:
pip install PySimpleGUIdebugger
or if you need to upgrade later:
pip install --upgrade --no-cache-dir PySimpleGUIdebugger
Should this not work, you can copy and paste the file PySimpleGUIdebugger.py into your application folder.
Integrating PySimpleGUIdebugger Into Your Application
There are 3 lines of code to add to a PySimpleGUI program in order to make it debugger ready - The import, an initialization, once each time through the even loop.
Here is an entire program including this integration code:
import PySimpleGUI as sg
import PySimpleGUIdebugger
"""
    Demo program that shows you how to integrate the PySimpleGUI Debugger
    into your program.
    There are THREE steps, and they are copy and pastes.
    1. At the top of your app to debug add
            import PySimpleGUIdebugger
    2. Initialize the debugger by calling:
            PySimpleGUIdebugger.initialize()
    2. At the top of your app's event loop add
            PySimpleGUIdebugger.refresh(locals(), globals())
"""

PySimpleGUIdebugger.initialize()

layout = [
            [sg.T('A typical PSG application')],
            [sg.In(key='_IN_')],
            [sg.T('        ', key='_OUT_')],
            [sg.Radio('a',1, key='_R1_'), sg.Radio('b',1, key='_R2_'), sg.Radio('c',1, key='_R3_')],
            [sg.Combo(['c1', 'c2', 'c3'], size=(6,3), key='_COMBO_')],
            [sg.Output(size=(50,6))],
            [sg.Ok(), sg.Exit()],
        ]


window = sg.Window('This is your Application Window', layout)
window.Element('_OUT_').Update(background_color='red')
# Variables that we'll use to demonstrate the debugger's features
counter = 0
timeout = 100

while True:             # Event Loop
    PySimpleGUIdebugger.refresh(locals(), globals())            # call the debugger to refresh the items being shown
    event, values = window.Read(timeout=timeout)
    if event in (None, 'Exit'):
        break
    elif event == 'Ok':
        print('You clicked Ok.... this is where print output goes')
    counter += 1
    window.Element('_OUT_').Update(values['_IN_'])
Using PySimpleGUIdebugger
To use the debugger in your code you will need to add TWO lines of code:
The import at the top of your code:
import PySimpleGUIdebugger
You need to "initialize" the PySimpleGUIdebugger package by calling near the top of your code. This is what creates the debugger window:
PySimpleGUIdebugger.initialize()
This "refresh" call that must be added to your event loop. Your window.Read call should have a timeout value so that it does not block. If you do not have a timeout value, the debugger will not update in realtime.
Add this line to the top of your event loop.
PySimpleGUIdebugger.refresh(locals(), globals())
Requirements
You'll need to have PySimpleGUI installed.
The debugger itself is written using PySimpleGUI, the tkinter version. It could be changed to use Qt for example.
What's it good for, when should it be used??
Hell if I know. Maybe it's a terrible idea! Or, maybe it'll be really helpful, particularly in situations where you don't have many resources on the target system and perhaps you can't fit a debugger onto that system. PySimpleGUIdebugger provides another tool for your PySimpleGUI GUI Toolbox.
Design
Author
Mike B.
License
GNU Lesser General Public License (LGPL 3) +

